
Back when I was still masking on the subway for covid (to avoid missing things) I also did some air quality measuring. I found that the subway and stations had the worst air quality of my whole day by far, over 1k ug/m3, and concluded:
Based on these readings, it would be safe from a covid perspective to remove my mask in the subway station, but given the high level of particulate pollution I might as well leave it on.
When I stopped masking in general, though, I also stopped masking on the subway.
A few weeks ago I was hanging out with someone who works in air quality, and they said subways had the worst air quality they'd measured anywhere outside of a coal mine. Apparently the braking system releases lots of tiny iron particles, which are bad for your lungs like any tiny particles. This reminded me that I'd looked at this earlier, and since I spend ~3hr in the system weekly (platform + train) it seemed worth going back to masking. I've now been masking for a week, and am planning to keep it up.
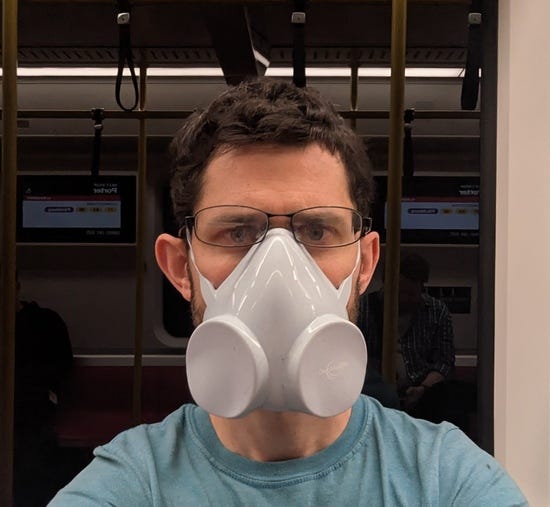
This is an ElastoMaskPro reusable N95 I got for elastomeric fitting. Very easy to breath through, which helps make up for how my beard makes it hard to get a tight seal.
At $30 (vs $0.60 for my favorite disposable) a reusable one comes out ahead after five weeks if I follow the guidance of using single-use ones only once. Now, when I used disposables I would reuse them many times, but the efficacy likely dropped off a bunch: the fit is worse because the elastic stretches, and they get beat up a bit in my backpack. Likely still cheaper to use the reusable one, given how long it should last, but with how I'd use them most of the gains are in efficacy and not cost.
On the other hand, if I wanted to be able to talk to people I'd go with the disposable: the ElastoMaskPro is worse for intelligibility than all the respirators I tested a few months ago.
Looking at the graph in the linked air quality post, it looks like pm2.5 peaks below 100 ug/m3. Unless I'm reading wrong, it's the CO2 axis / line which briefly exceeds 1000 (ppm)?