Boston Rents Over Time

A friend asked about the seasonality of Boston rents, wondering if there was a good time to look. Short answer: sooner is better.
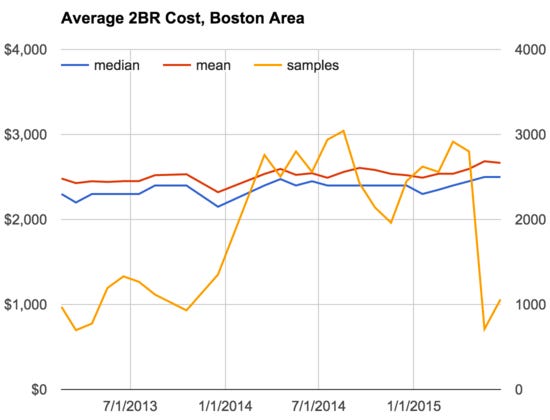
Both the mean and median rent are rising over time, going up about $100 or 4% per year. There doesn't seem to be much of a pattern for when in the year is cheapest.
About the data: I have 28 months of listings from Padmapper that originally come from Craigslist. This is for a rectangle that roughly represents what people seem to mean when they say "closer suburbs," reaching about half way out to route 128. You can see this visualized on jefftk.com/apartment_prices. Here I've calculated the mean and median rent from the 2-bedroom listings only. The number of listings does vary widely. I don't know whether it varies primarily because of people listing fewer apartments or something going wrong with Padmapper's scraping pipeline. I've excluded four months with very low samples from the chart above: 9/2013, 11/2013, 1/2014, and 2/2014.
date median cost mean cost samples 2013-02-18 $2300 $2482 972 2013-03-18 $2200 $2428 698 2013-04-18 $2300 $2450 776 2013-05-18 $2300 $2442 1194 2013-06-18 $2300 $2451 1331 2013-07-18 $2300 $2452 1267 2013-08-18 $2400 $2521 1117 2013-09-18 $2100 $2410 163 2013-10-18 $2400 $2532 931 2013-11-18 $3050 $2959 37 2013-12-18 $2150 $2321 1352 2014-01-18 $2400 $2465 63 2014-02-18 $2200 $2515 80 2014-03-18 $2400 $2536 2759 2014-04-18 $2475 $2595 2505 2014-05-18 $2400 $2525 2801 2014-06-18 $2450 $2544 2560 2014-07-18 $2400 $2491 2939 2014-08-18 $2400 $2559 3043 2014-09-18 $2400 $2607 2427 2014-10-18 $2400 $2583 2142 2014-11-18 $2400 $2537 1962 2014-12-18 $2400 $2521 2451 2015-01-18 $2300 $2492 2622 2015-02-18 $2350 $2538 2560 2015-03-18 $2400 $2538 2915 2015-04-18 $2450 $2595 2801 2015-05-18 $2500 $2685 711 2015-06-18 $2500 $2666 1060
Comment via: google plus, facebook